Let’s face it, trading the stock market can be challenging. Even the most elite fund managers in the world will tell you that making consistent above-market returns is something that even they struggle to do year in year out. They will also tell you that the single most important tool you can have when trading the market is a set of trading rules to guide you through the emotional rollercoaster that is the stock market. This is precisely why algorithmic trading is such a powerful tool.
At Beat the Market Australia, our members benefit from free access to our licensed partners’ state of the art trading algorithms currently being used by some of the smartest and most successful traders in the business.
Why is an algorithmic approach to trading so important?
Trading algorithmically is the best way to remove emotion from your trading decisions. We all know that emotional investing leads to greater losses and this is why we are seeing more and more professionals incorporate the use of backtested systematic rules in their trading strategies.
We are our own worst enemies when it comes to being profitable in the market. We’ve all seen how easy it is to lose money by holding on to falling stocks, promising to sell on the next leg up which never comes. Similarly, we’ve all prematurely sold out of a profitable position only to see it double, then triple, then quadruple.
Algorithmic trading overcomes this problem by providing you with clear, defined rules that have produced sustained profits over years of historical trading data. This removes the need to trade based on emotionally charged decisions and avoids the biggest risk to profitable trading – i.e. ourselves.
Here is a short video explaining algorithmic or ‘algo’ trading:
An algorithm that has generated 28% return per year on auto-pilot
One of our licensed partner’s flagship ETF Pairs Strategy is a market neutral algorithm that capitalises on the structural slippage inherent in many listed ETF products. It does not take a view on whether the market will rise or fall but instead works to maintain a market neutral exposure and scalp profit from the inevitable depreciating nature of many high-cost ETFs.
The following chart shows the 4-year performance of an initial investment of $50,000 at $15 minimum brokerage per trade:
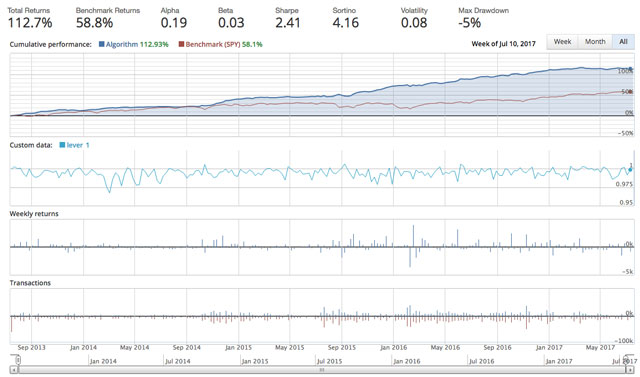
Please note that past returns are no indication of future returns and trading financial markets can result in large losses. That siad, let’s have a closer look at some of the key metrics of the strategy.
Key metrics:
- Total vs Benchmark Returns: Over the 4 year period shown above, clients with $50,000 in initial capital grew their portfolio to $106,350. This represented an 112.7% total return or 28.17% per annum – a notable and consistent outperformance of the benchmark rate of return of 58.8% or 14.7% per annum achieved had they invested in a typical index fund that tracks the s&p 500 index.
- Low Beta: Beta represents the tendency of the portfolio’s returns to respond to swings in the market. A beta of 1 indicates that portfolio returns will move with the market. In this case, the beta of 0.03 indicates that portfolio returns are almost completely independent of broader market moves. This kind of asymmetry in returns gives investors confidence that the strategy will perform well even during bear markets and act as a safe haven during sharp market crashes.
- High Sharpe Ratio: The purpose of the Sharpe ratio is to show how much greater a return one obtains in relation to the level of additional risk taken to generate that return. According to Investopedia, a Sharpe ratio greater than 1 is typically considered good and a ratio higher than 2 is rated as very good. In this case, the Sharpe ratio of 2.41 indicates that the risk-adjusted return of the strategy is considered ‘very good’ by industry standards.
- Low Max Drawdown: A maximum drawdown is the maximum percentage loss from a peak to a trough of a portfolio before a new peak is attained. This means that, over the past 4 years, the portfolio value of the above strategy never fell by more than 5% at any given time before continuing to move higher. This is a much more favorable maximum drawdown than can be expected from a typical index fund tracking the s&p 500 index, as indicated by the smoother portfolio equity line in the chart above.
What’s the catch?
Like all things that look too good to be true, there’s usually always a catch. In this case, the catch is that this particular algo strategy is not easily scalable. What this means is that it can be effectively traded with $1 million or less, but much harder to trade with $100 million because of the limited volumes of shortable stock available in the required ETFs at any given time.
Effectively, this excludes larger fund managers from using this strategy and leaves the opportunity open for sophisticated retail investors looking to potentially earn in excess of 28% return on a portion of their portfolio if history repeats (which it doesn’t always). The only problem is that the complexity of the algorithm and the technology required to implement it often excludes most retail investors from using it successfully.
This is where we come in. At Beat the Market Australia, we have relationships with broking partners that have the technology and sophistication to run this algorithm on behalf of their retail clients. Whether you require trade alerts in your inbox or a completely managed solution, all you need to do is get yourself set up with a free account. The account opening process is free of charge and will only take you a few minutes.
Simply email support@beatthemarket.com.au and mention that you would like to open an account to trade our partner’s ETF Pairs Algorithm.
Alternatively, you can register for your free Beat the Market membership and we will contact you directly with an introduction.